U.S. E-commerce Company
Marketplace. Mobile App & Website
Client
NDA
Services
Product Design
Industries
E-commerce
Date
2023—Present
Context
For the past two years, I’ve been working as a product designer to improve the user experience for a major U.S.-based marketplace. Due to an NDA, I can’t disclose its name.
As our user base grew, we started facing challenges: users felt overwhelmed by the amount of information, hesitated over prices, and often delayed their purchases. My role as a product designer was to dive into user behavior at key touchpoints and simplify their journey toward a confident purchase.
My Role
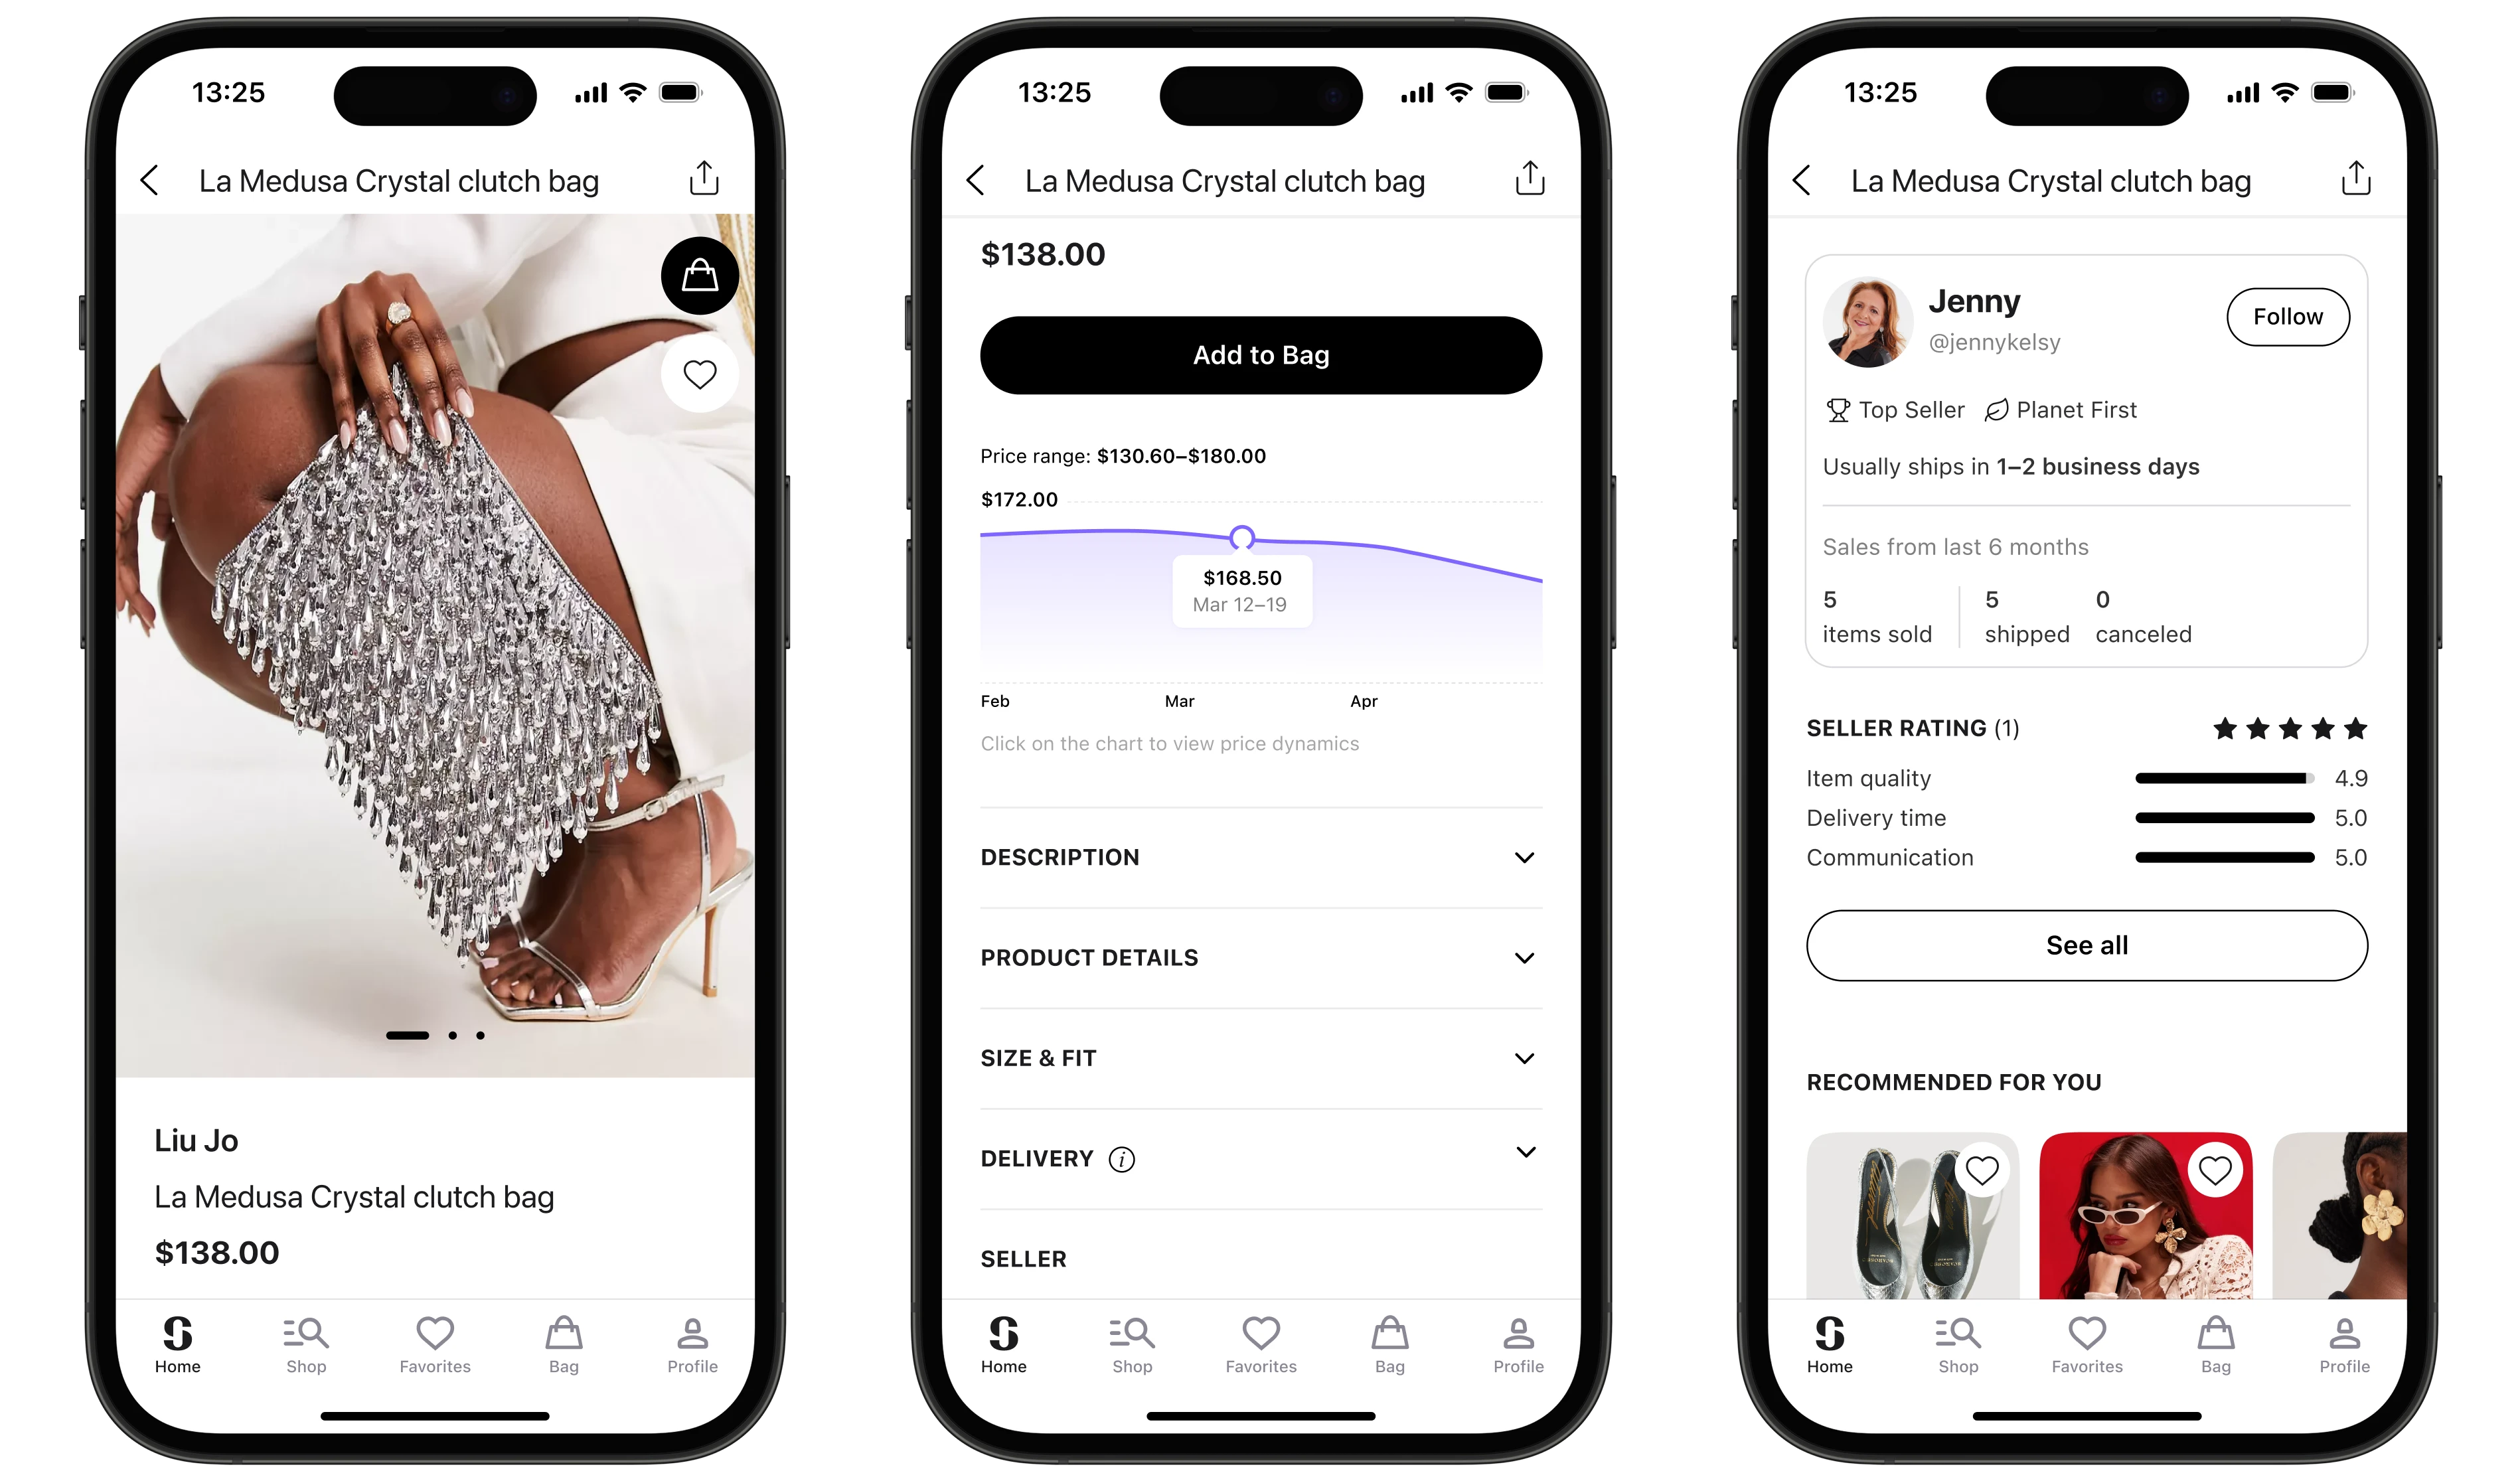
As a product designer, I led the redesign of the Product Detail Page (PDP) across iOS, Android, and Web platforms to boost user trust and conversion rates. My key initiative was developing a dynamic price history chart that helped users make decisions by showing how a product’s price had changed over time. I collaborated closely with a product manager, an analyst, an engineer, and another product designer to create a solution that not only addressed the problem but also scaled seamlessly for millions of users.
Challenge
By analyzing user behavior, we noticed that 65% of users who added items to their favorites returned to them 2–3 times but didn’t complete the purchase. Why? The question we faced was: how can we provide users with enough information to make a confident decision without overwhelming them? We hypothesized that visualizing price history would give us a new edge, reducing hesitation and increasing engagement.
Approach
To understand why users were delaying their purchases, we started by diving deep into their behavior. The question “What’s stopping them from acting right away?” became our guiding focus. I suggested we go straight to the source — users who frequently added items to their favorites but didn’t buy. After conducting interviews with 5 active users and hearing about their concerns and expectations, I realized: they were afraid of missing out on a better deal but weren’t sure if the price was fair or if it might drop later.
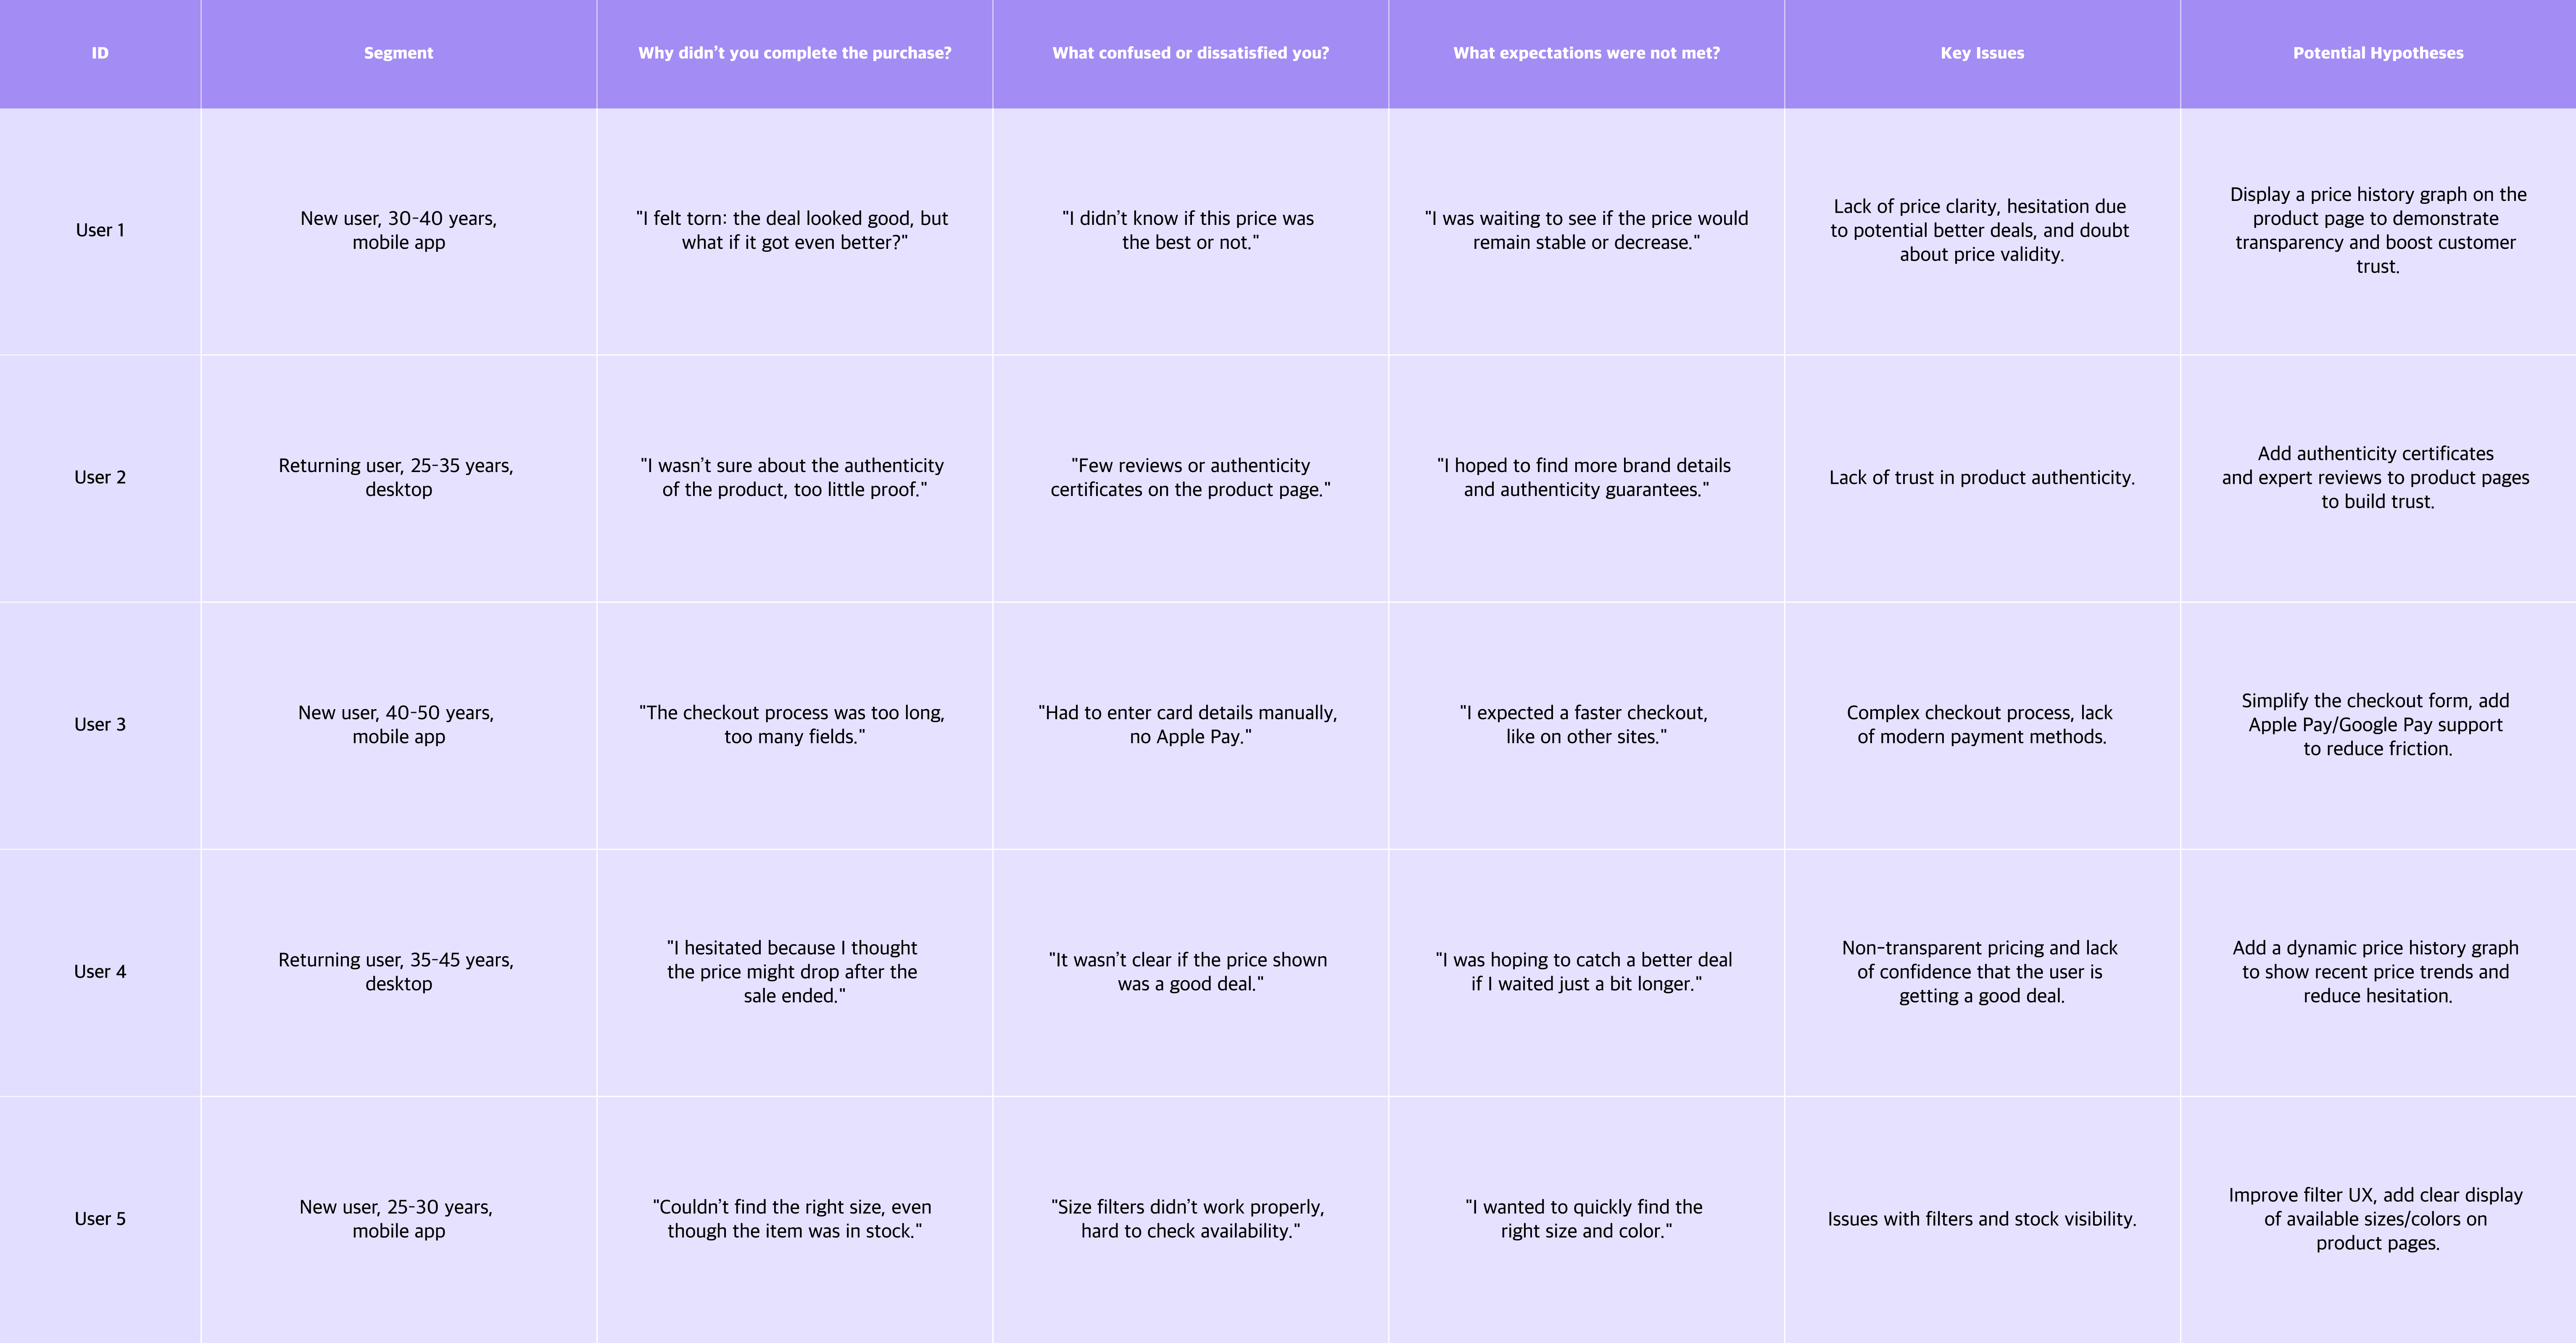
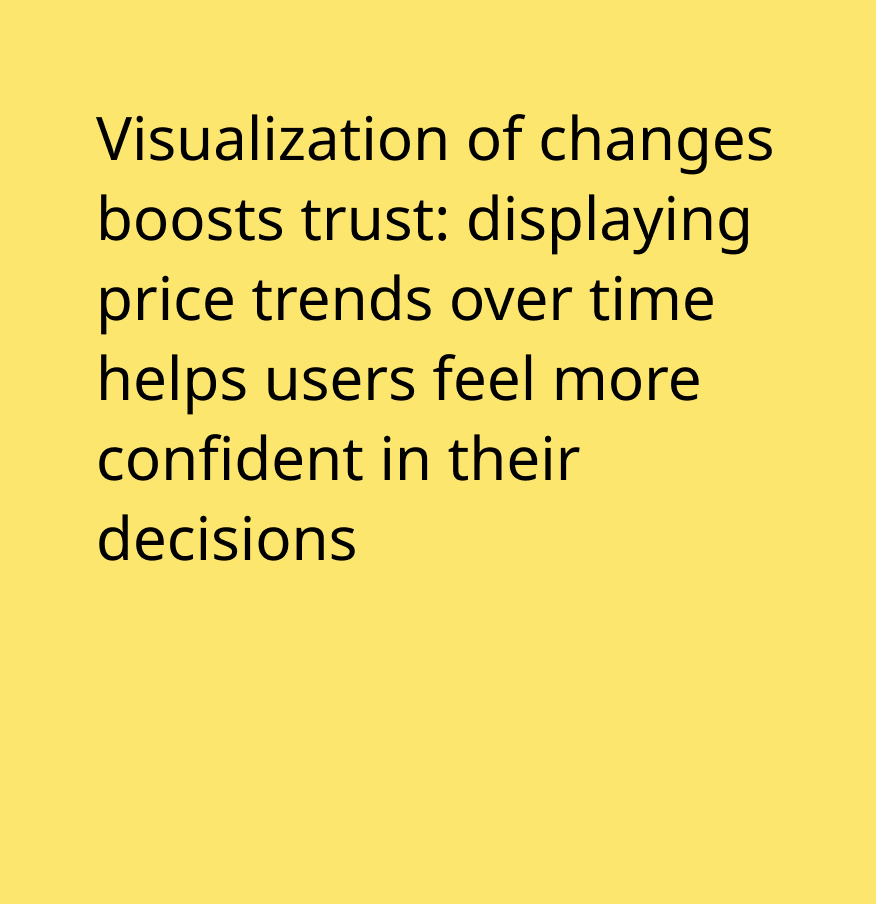
A lack of transparency in price trends was eroding trust and slowing down conversions. Meanwhile, our analyst provided data: users who had seen past discounts were 30% more likely to complete a purchase. This led us to our hypothesis:
We believed that a transparent price history would help users feel more confident. To test this hypothesis, we organized a 4-day sprint that combined research, prototyping, and testing.
Research and Insights
We kicked off with a competitive analysis, studying how eBay and StockX tackle the challenge of building trust in pricing. On eBay, for example, auction history was available but not intuitive, while StockX displayed market trends, which inspired us to create a dynamic price chart. At the same time, we reexamined user data with the team, which confirmed: uncertainty about whether a price was fair or might drop later was causing users to hold off on buying. Analytics added clarity: 65% of users who added an item to their favorites returned to it 2–3 times without making a purchase.
Prototyping
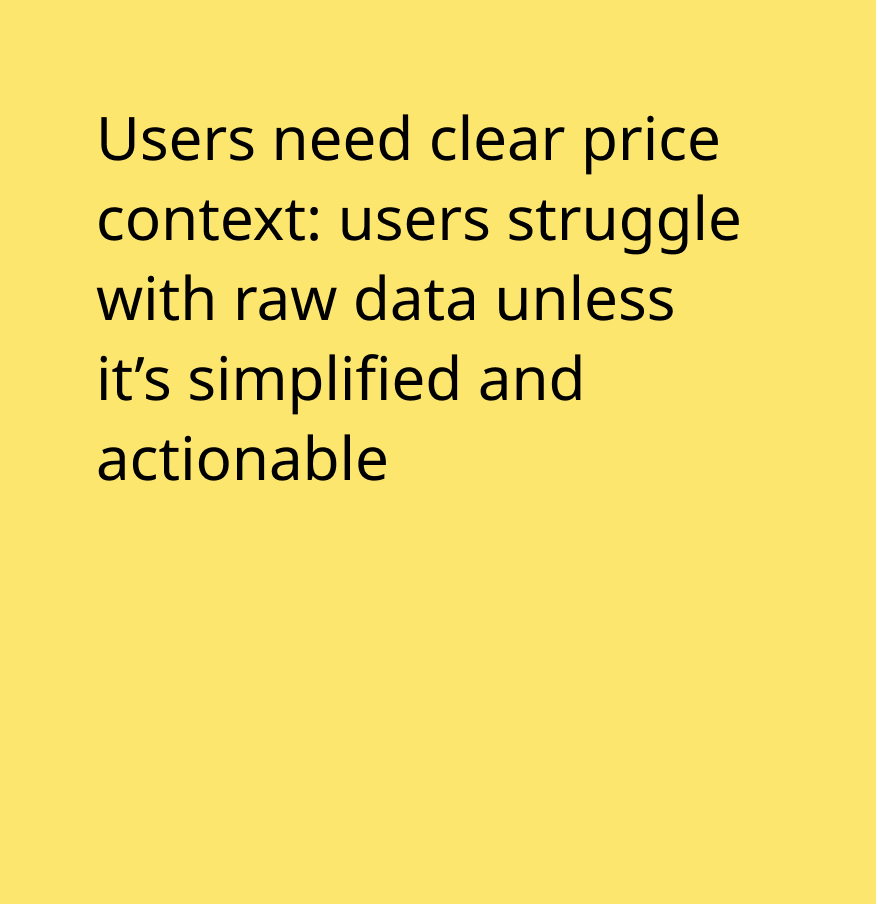
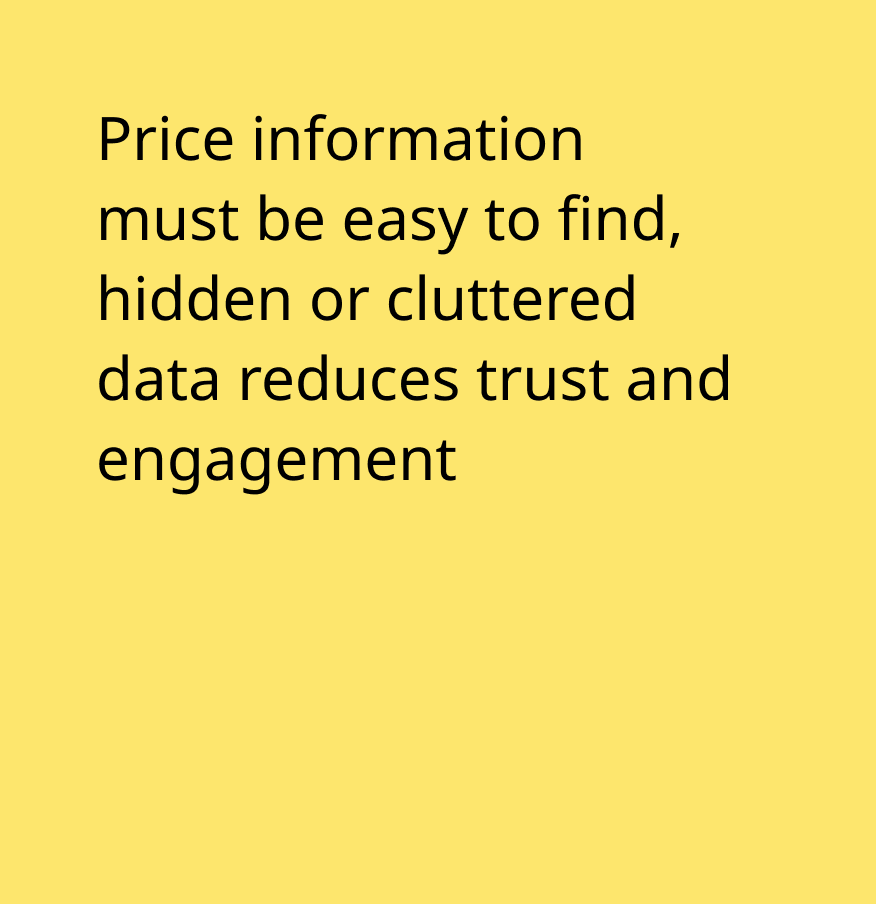
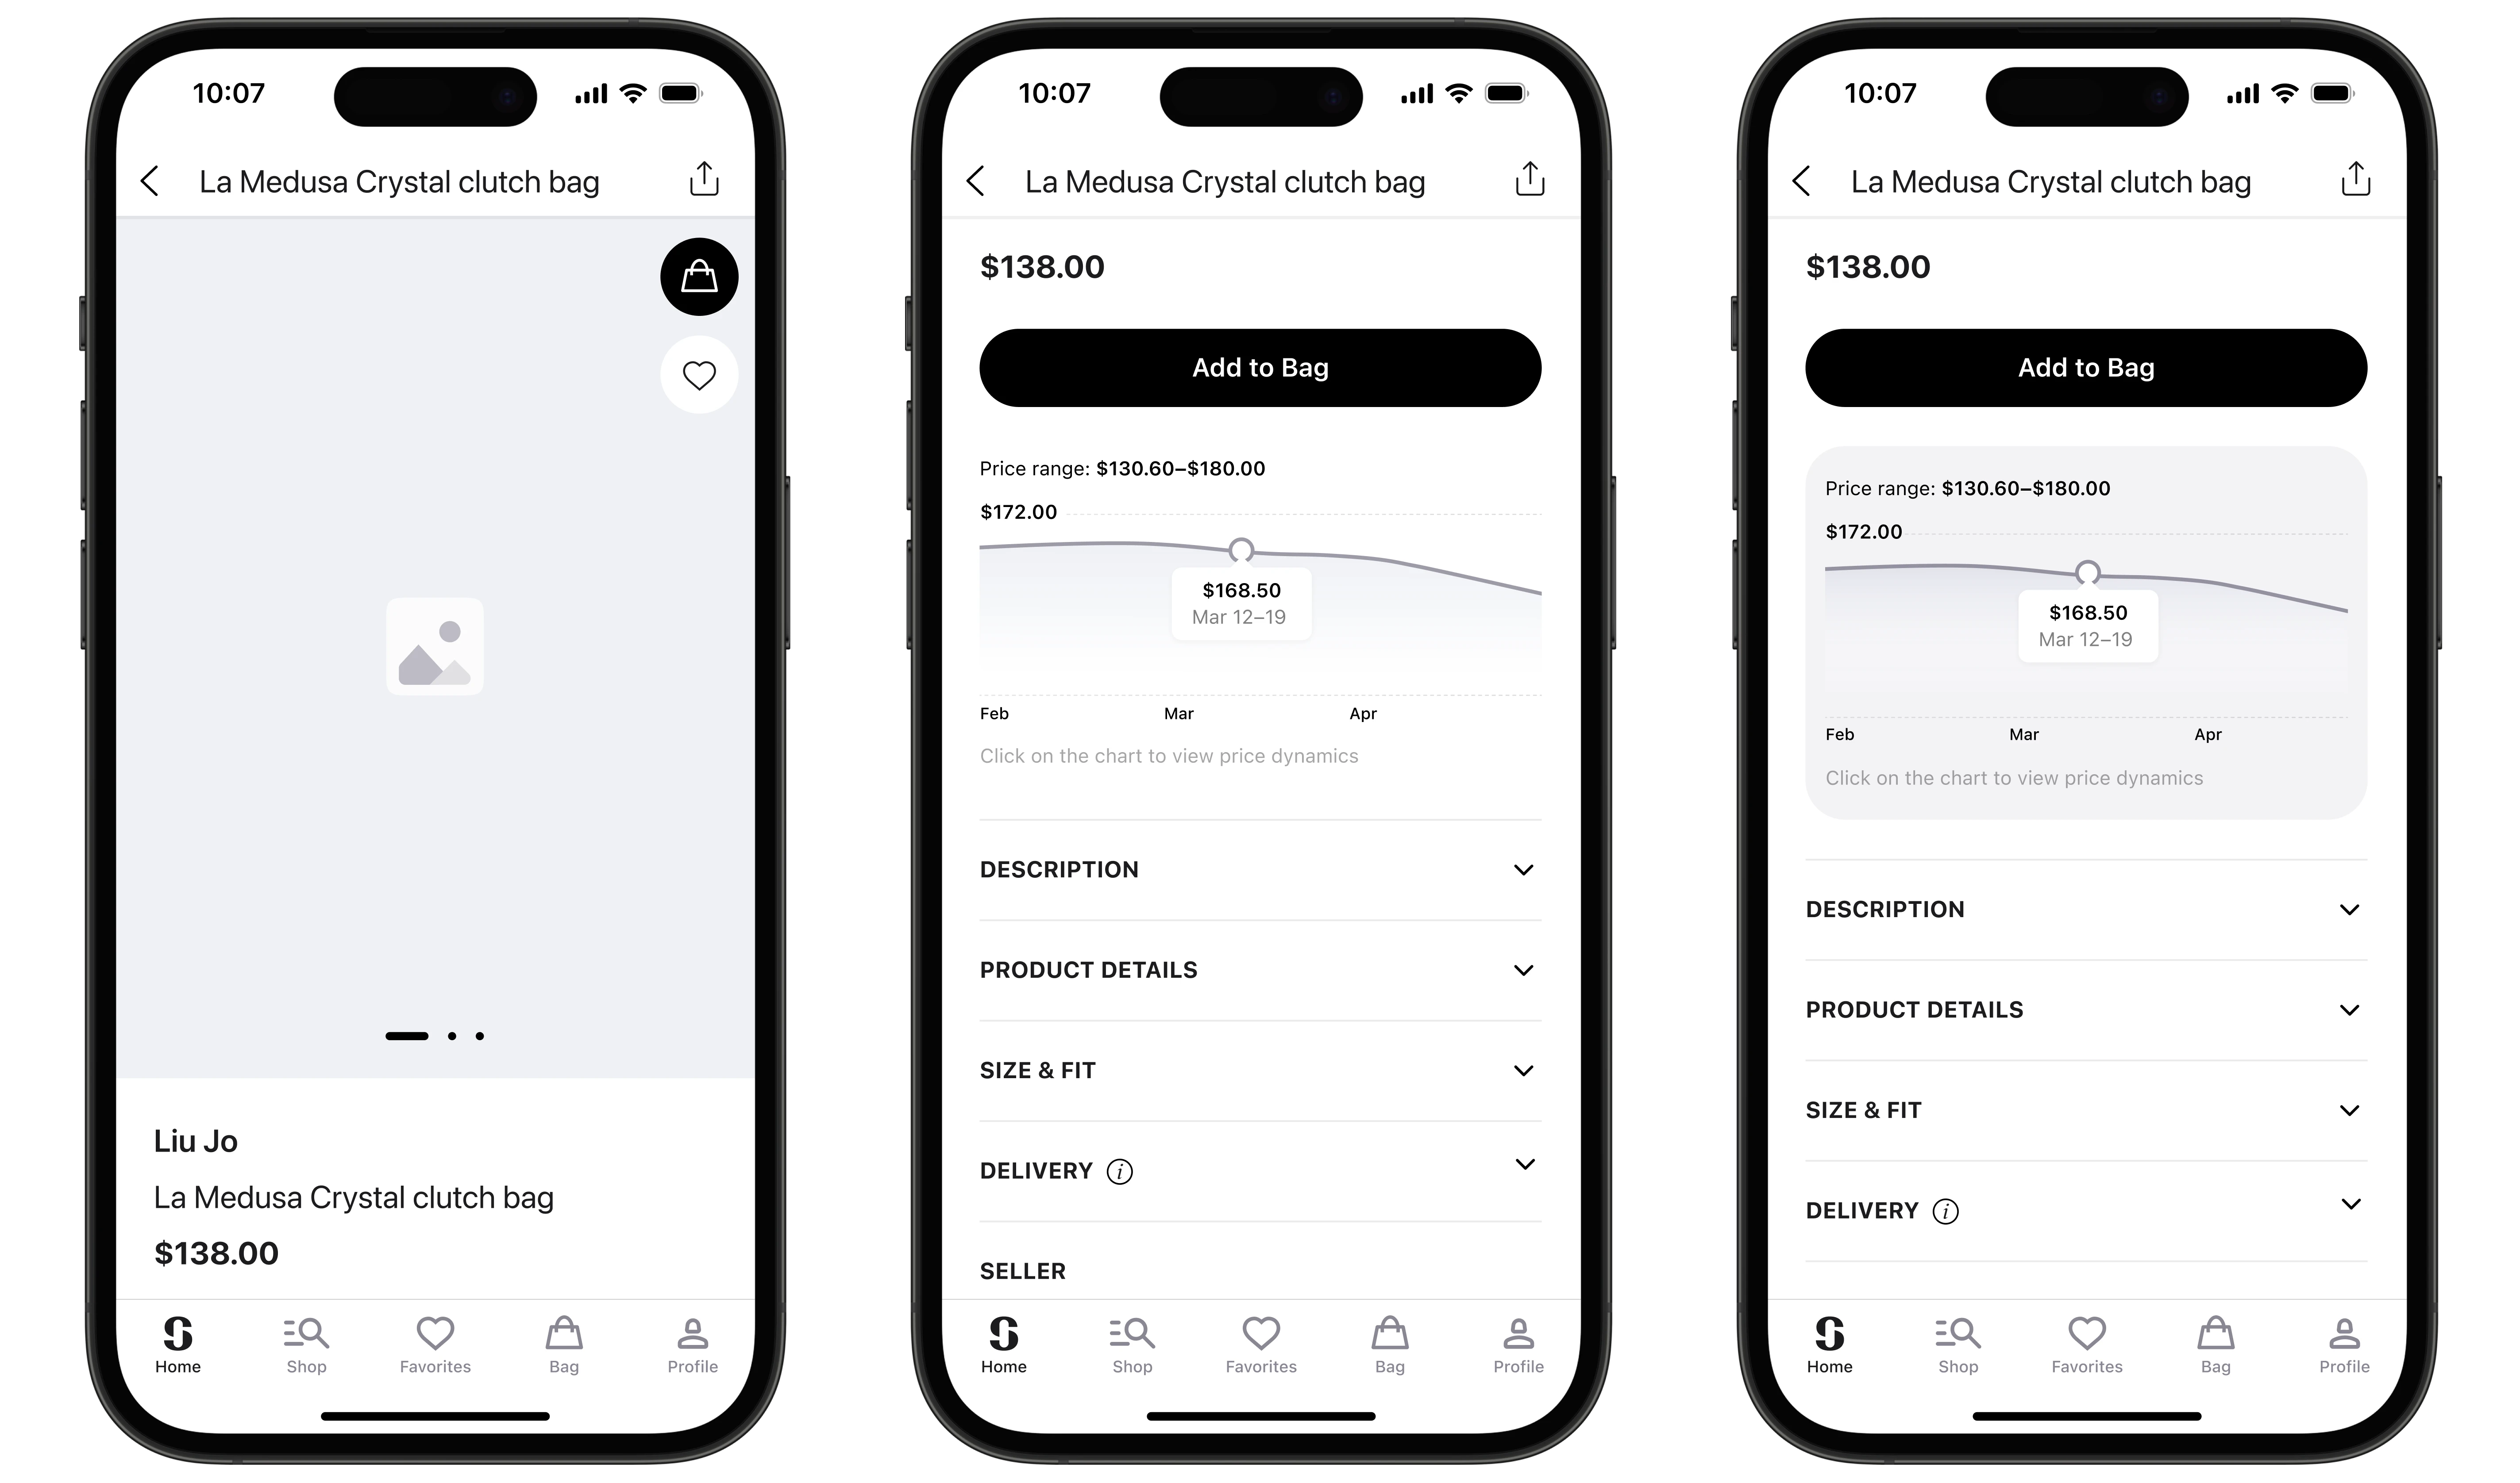
Based on these insights, I proposed a prototype for a dynamic price chart that showed price changes over the past 30 days. To avoid cluttering the product page, we made the chart optional — accessible with a tap. However, as I reflected on the user experience, I suspected that having the chart always visible might be more effective, especially for those who value instant access to information. This led to the idea of A/B testing two versions: a chart that expands on tap and one that’s always visible.
Testing and Iterations
To determine which chart version better helped users make purchase decisions, we ran an A/B test with 20 users. Each participant was randomly shown a product page with one of the two interface variants and asked to go through the journey from viewing to purchasing, sharing their thoughts along the way. We asked questions like: “Do you understand what the chart is showing? Does it help you decide? What would motivate you to buy right now?”
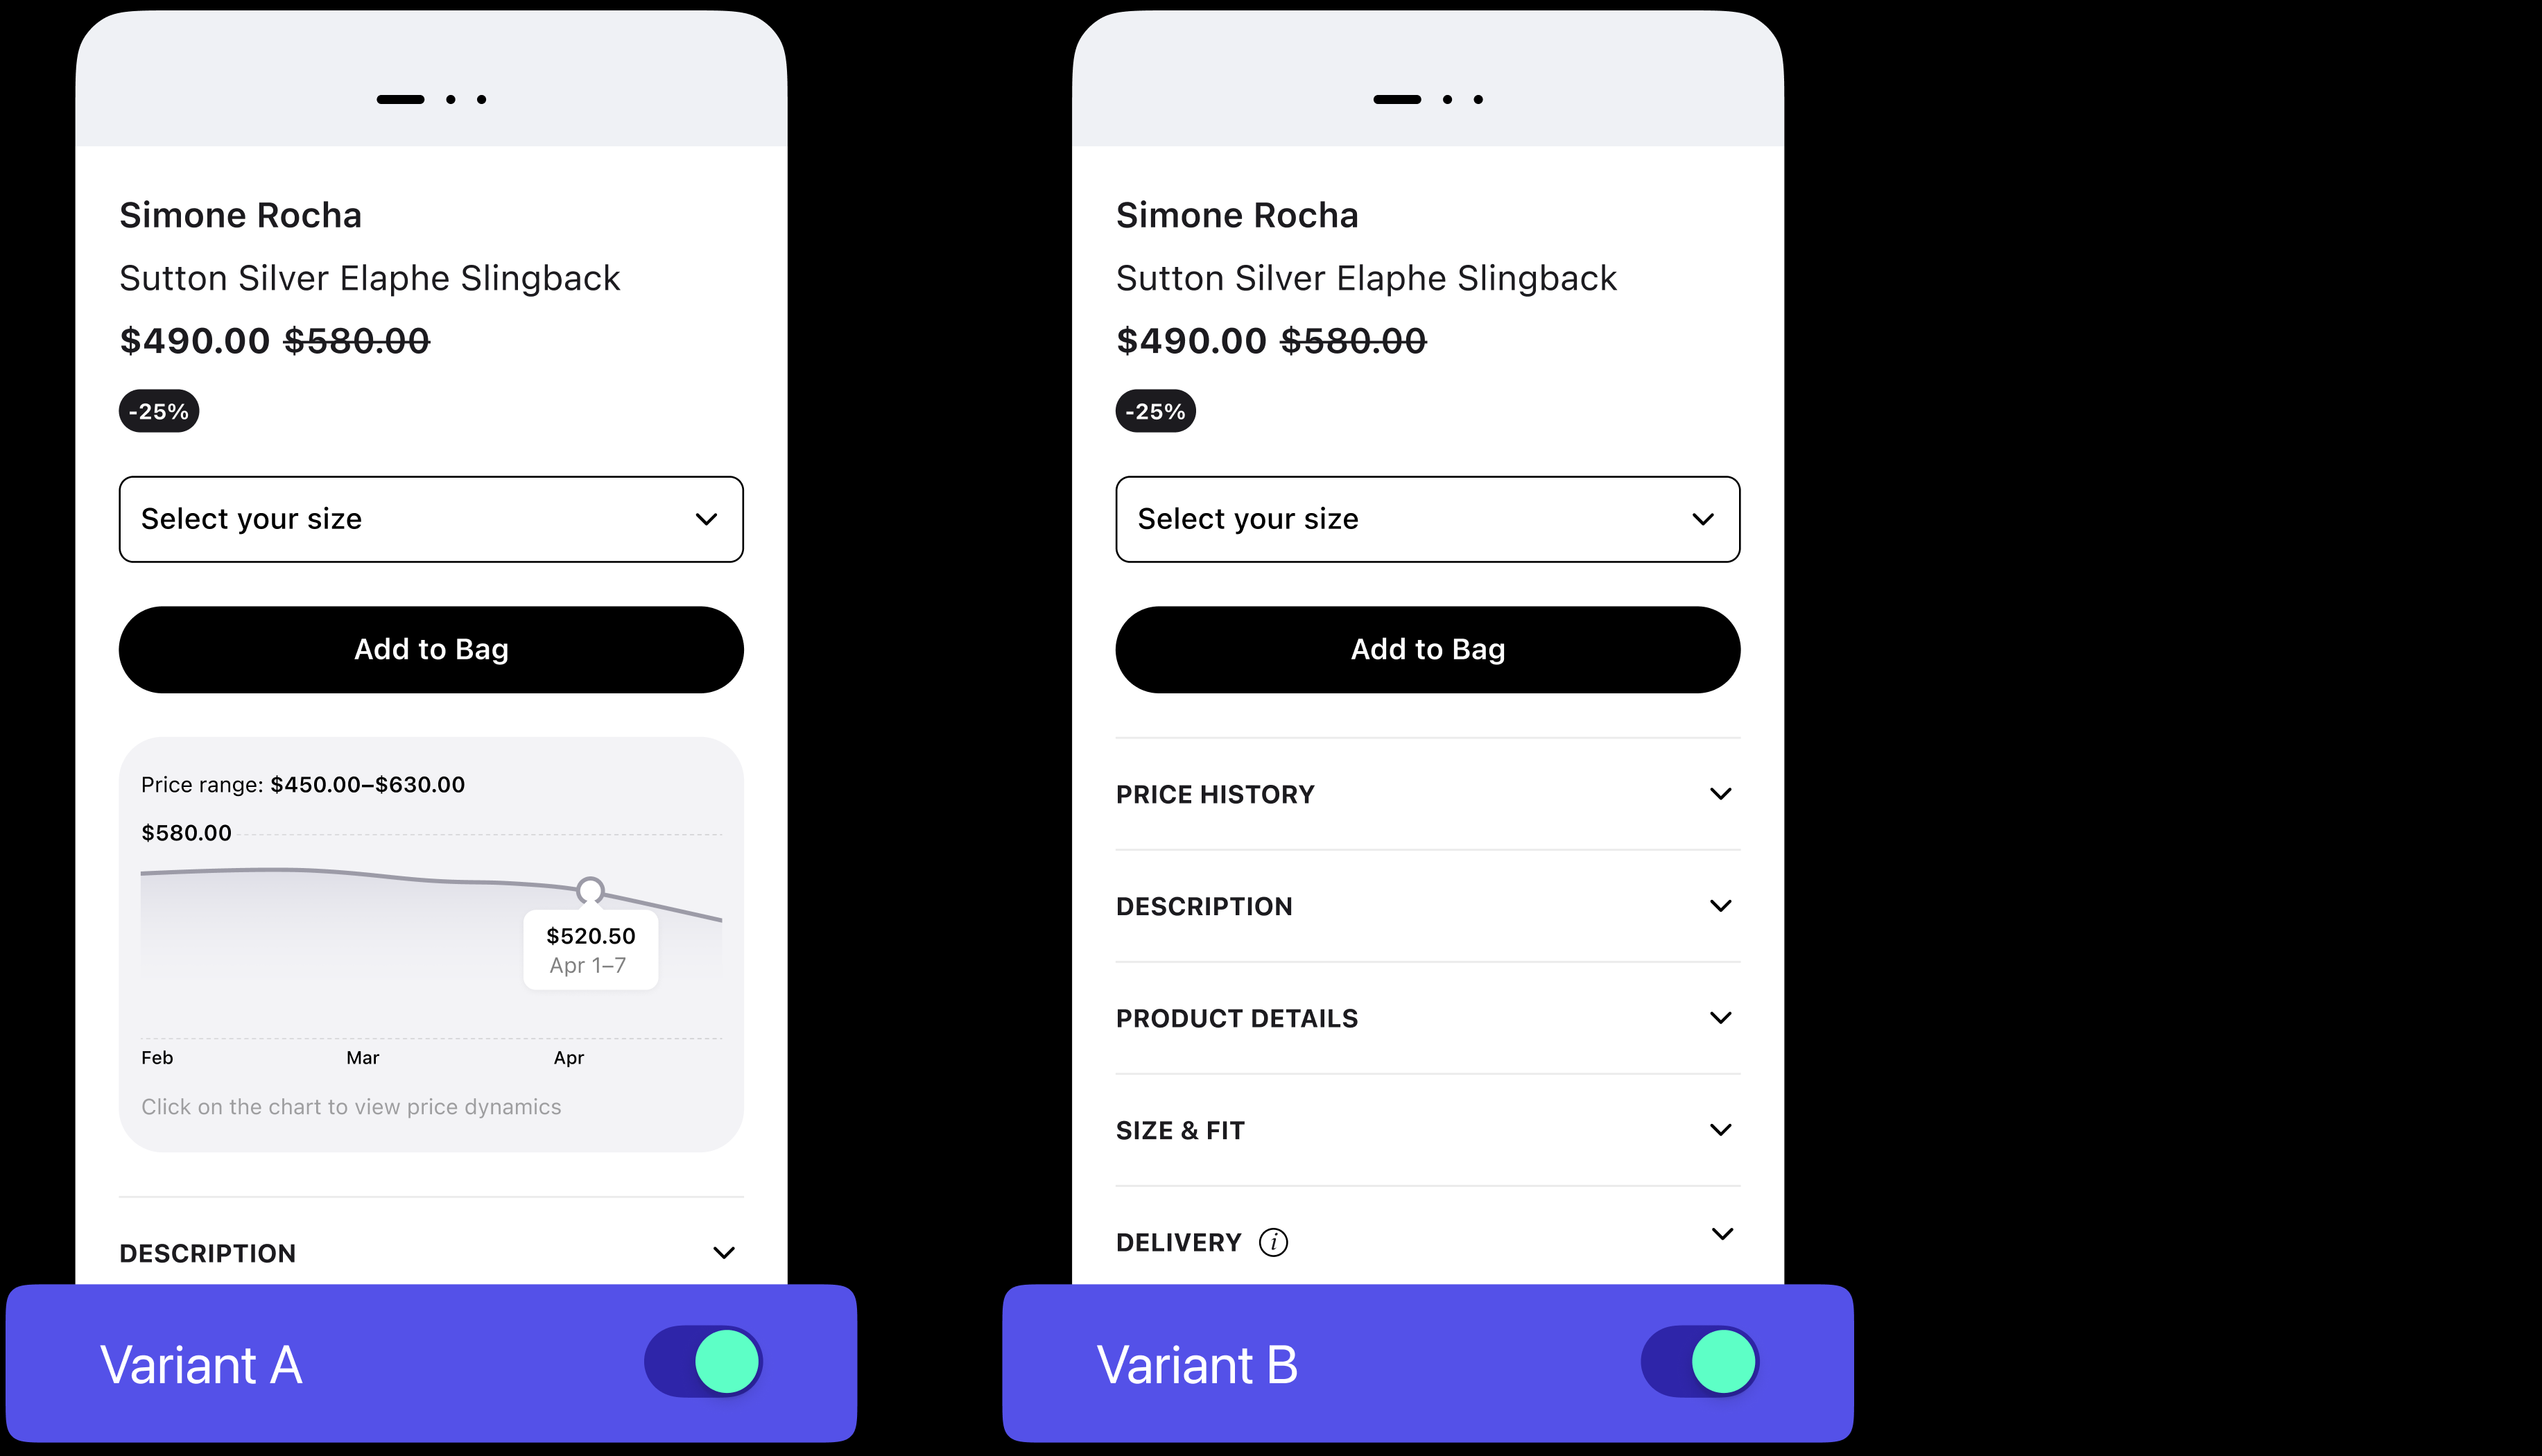
The A/B test results painted a clear picture. In the group with the always-visible chart, 90% of users noted that it immediately caught their attention and helped them assess the deal’s value, while 75% said it would speed up their decision to buy. In the tap-to-expand chart group, 80% found it useful, but only 55% noticed and opened it without prompting, highlighting an issue with discoverability. Interestingly, nearly half of the users in both groups requested price drop notifications.
These insights prompted us to create a second iteration, where we integrated push notifications for price changes to boost user confidence and reduce the fear of missing out on a better deal. We also refined the chart’s microcopy, adding a tooltip: “Today’s price is the best in 30 days,” to make the information even clearer. To confirm the effectiveness of these changes, we planned a larger-scale A/B test with real platform users, tracking conversion rates, time on page, and engagement.
Results
The large-scale A/B test validated our hypothesis: the always-visible price chart increased purchase conversions by 18% and reduced the average time from viewing to buying by 22% compared to the tap-to-expand version. Users who saw the chart upfront were more likely to complete their purchase, as it instantly signaled the deal’s value. Adding price drop notifications also proved effective: 30% of users who opted in returned and completed their purchase within a week.