CRM System. NDA
CRM System & MUI Library Design System
Client
NDA
Services
Product Design
Industries
CRM
Date
2024
Below are links to Figma for one of my CRM system projects, executed using the MUI library design system. The UI interface is built on a variables table, allowing for one-click switching between dark and light modes. There are also animations, such as document expansion in the table or sidebar collapsing.

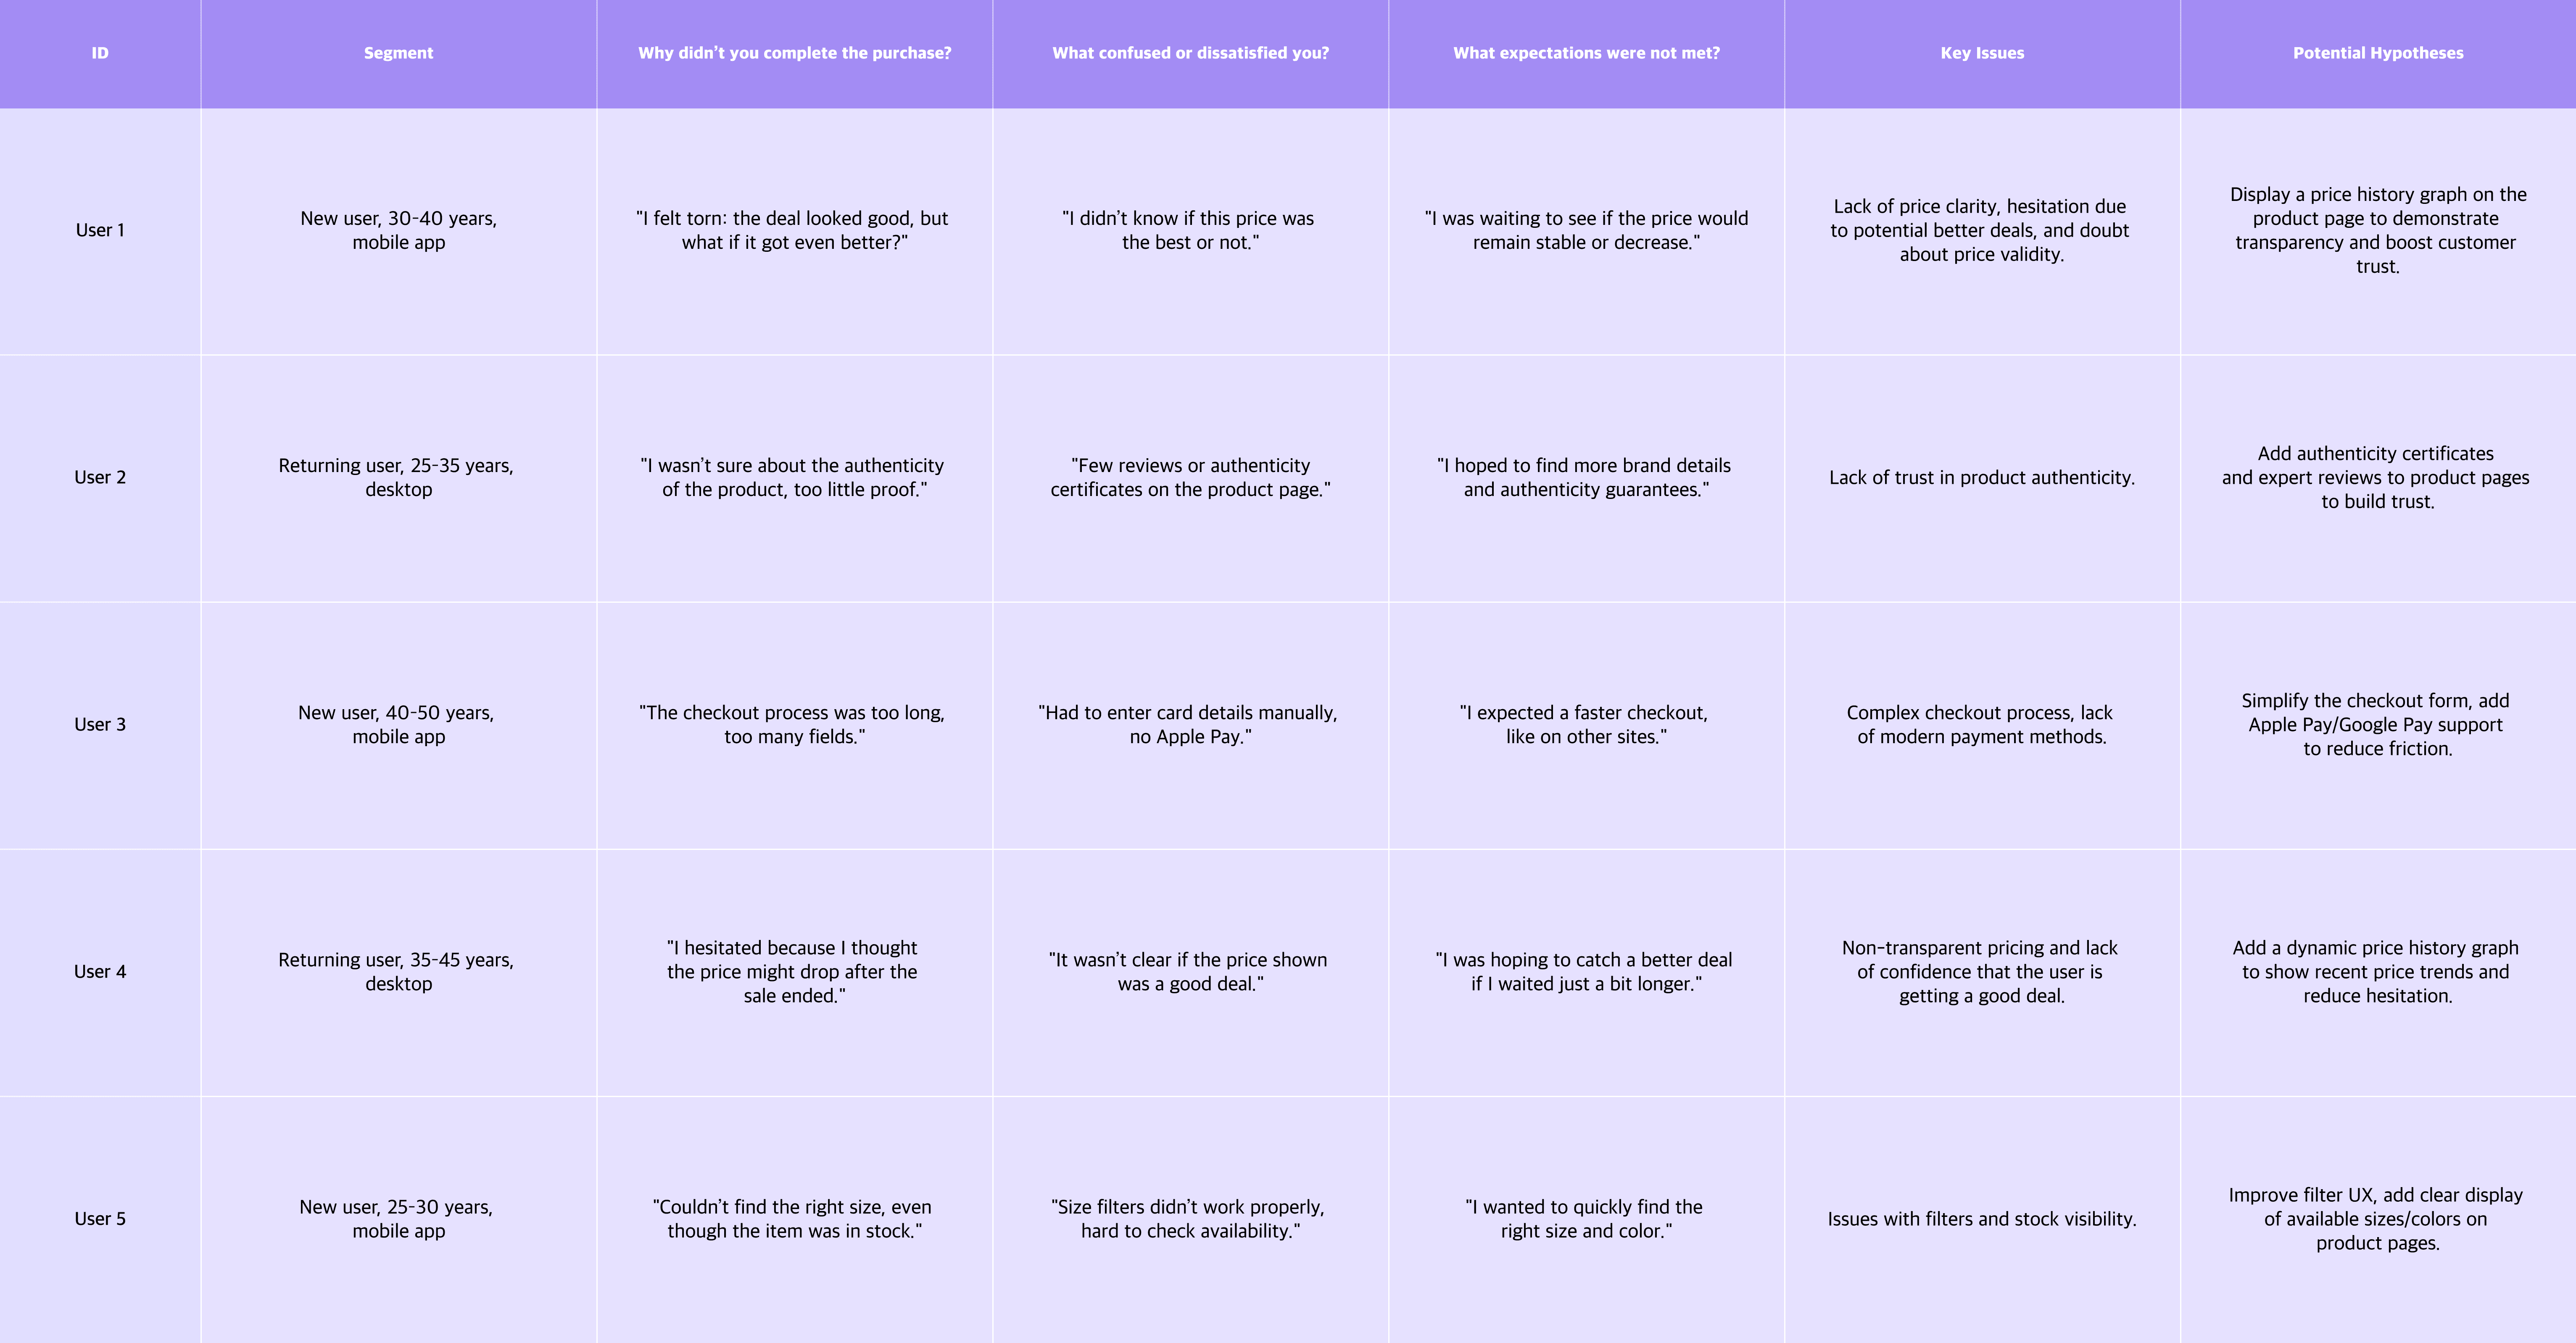
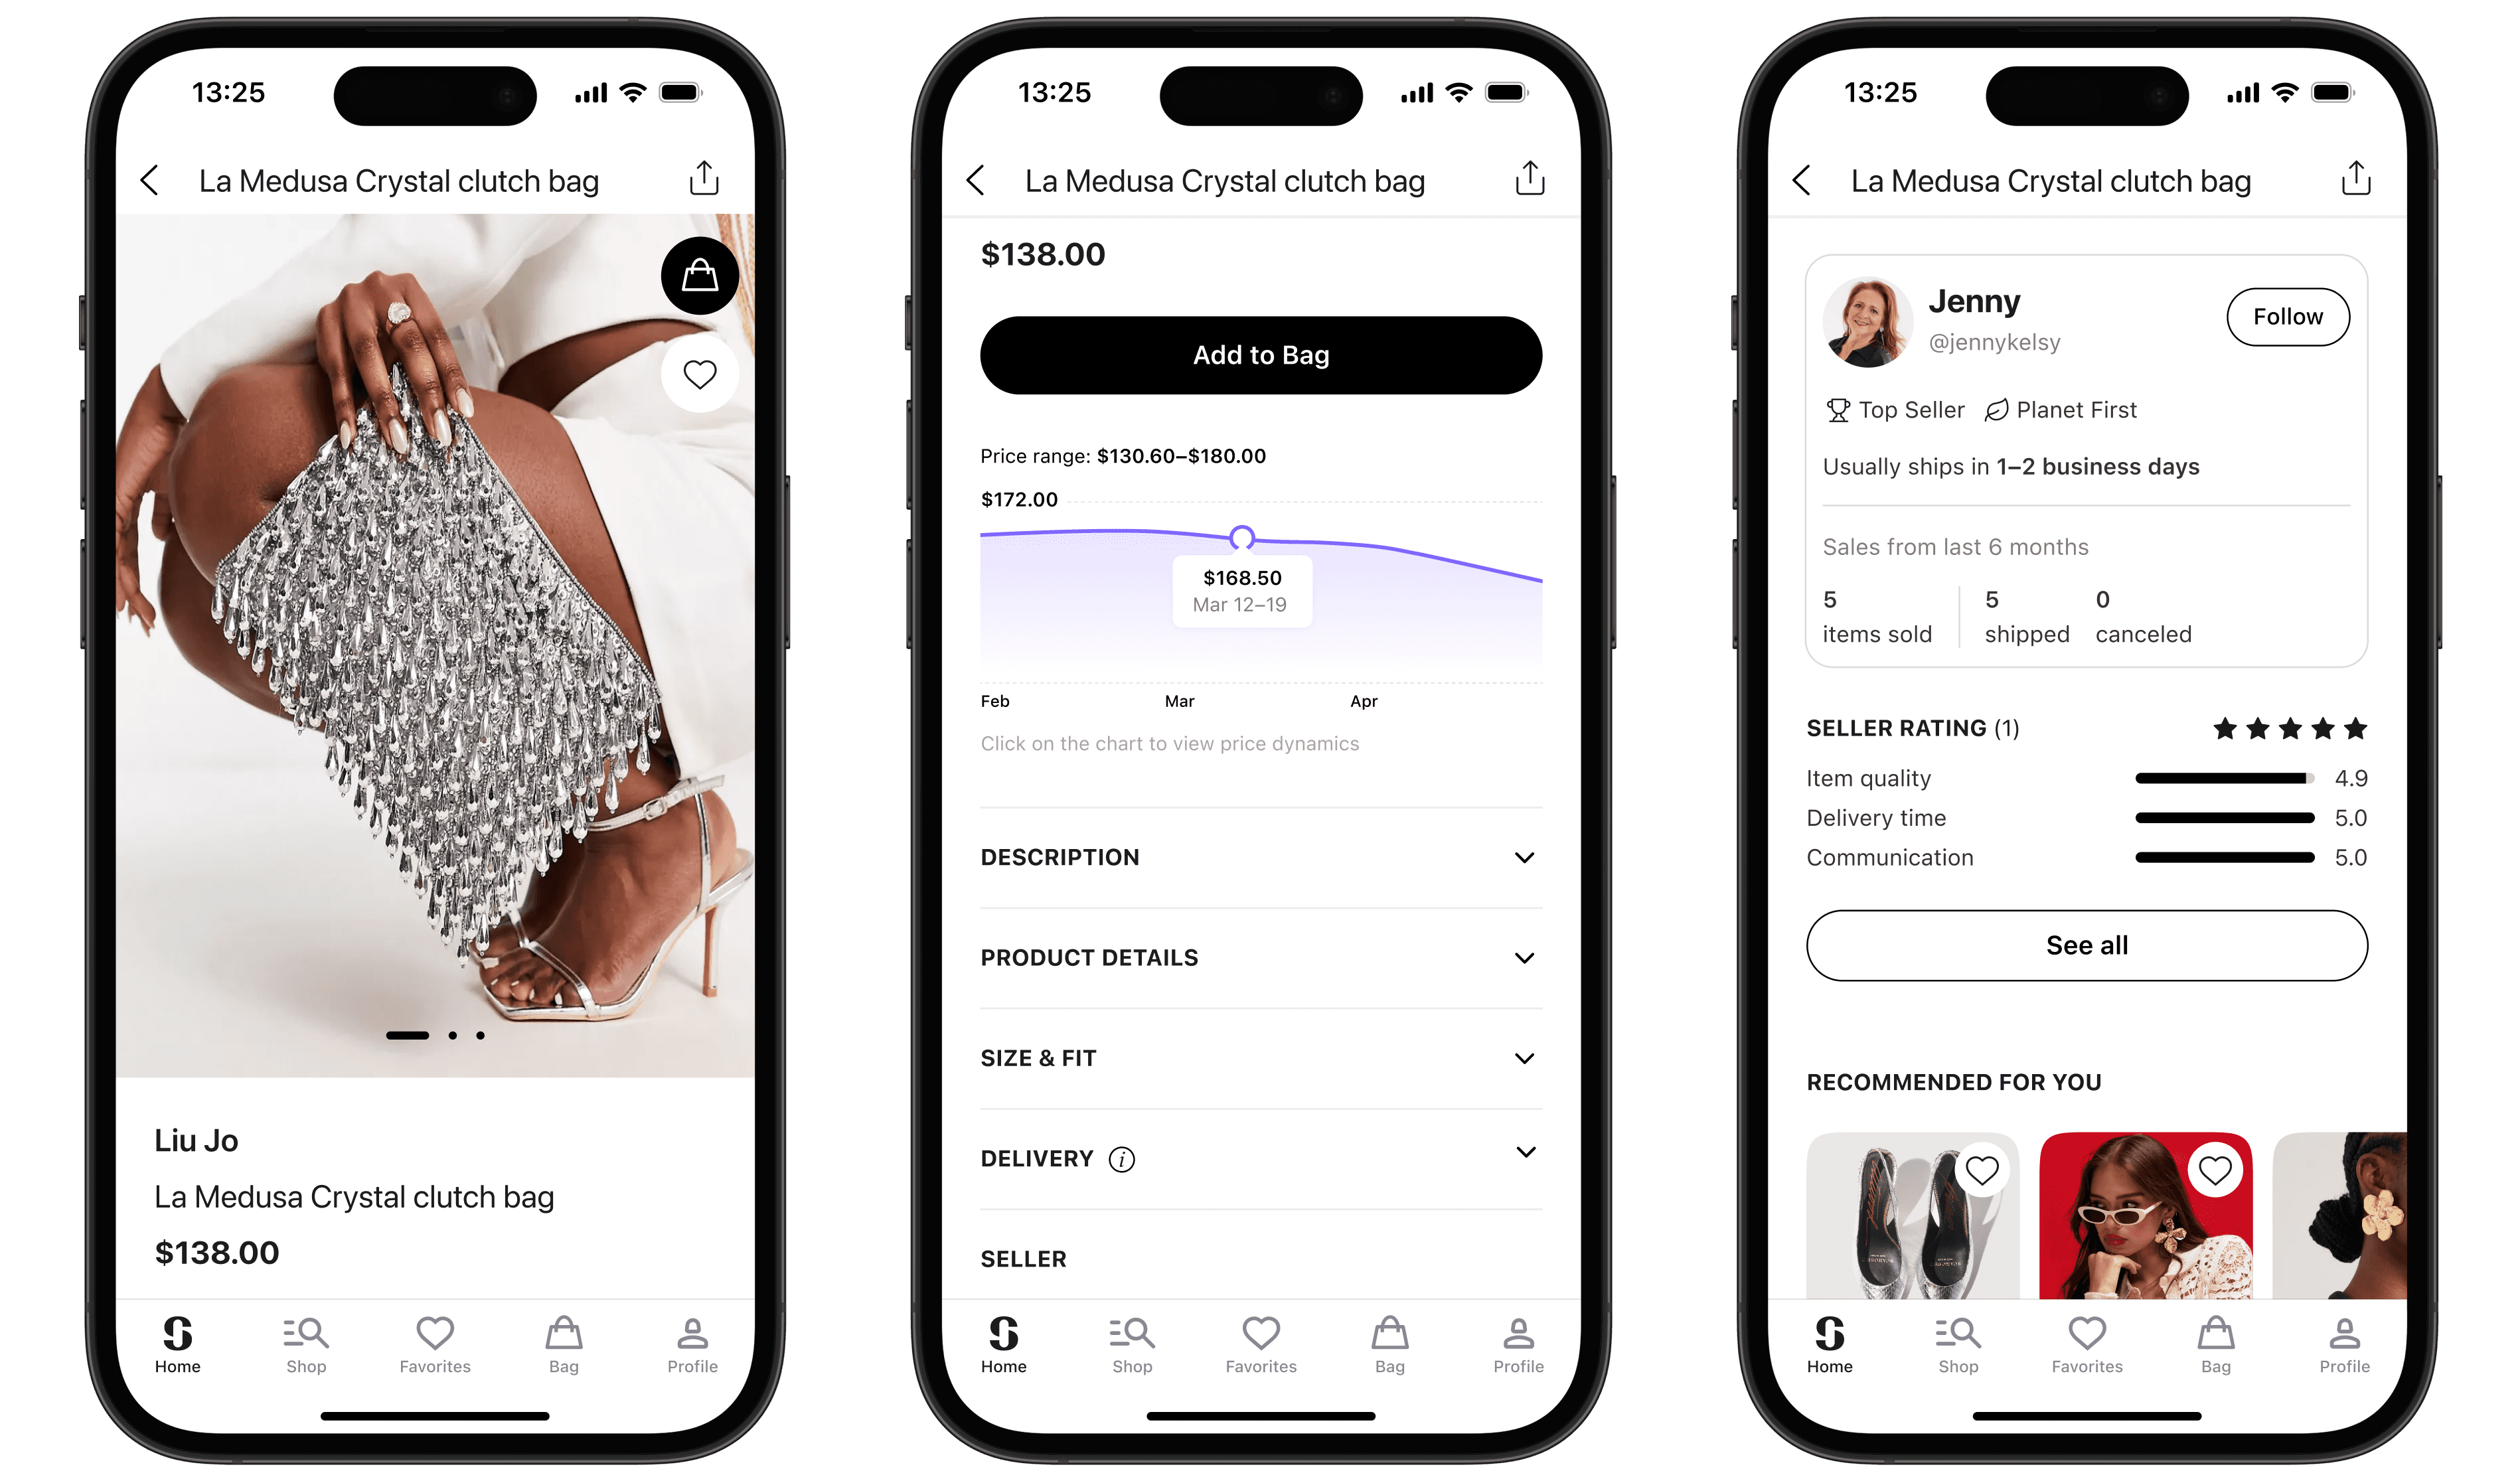
A lack of transparency in price trends was eroding trust and slowing down conversions. Meanwhile, our analyst provided data: users who had seen past discounts were 30% more likely to complete a purchase. This led us to our hypothesis:
We believed that a transparent price history would help users feel more confident. To test this hypothesis, we organized a 4-day sprint that combined research, prototyping, and testing.
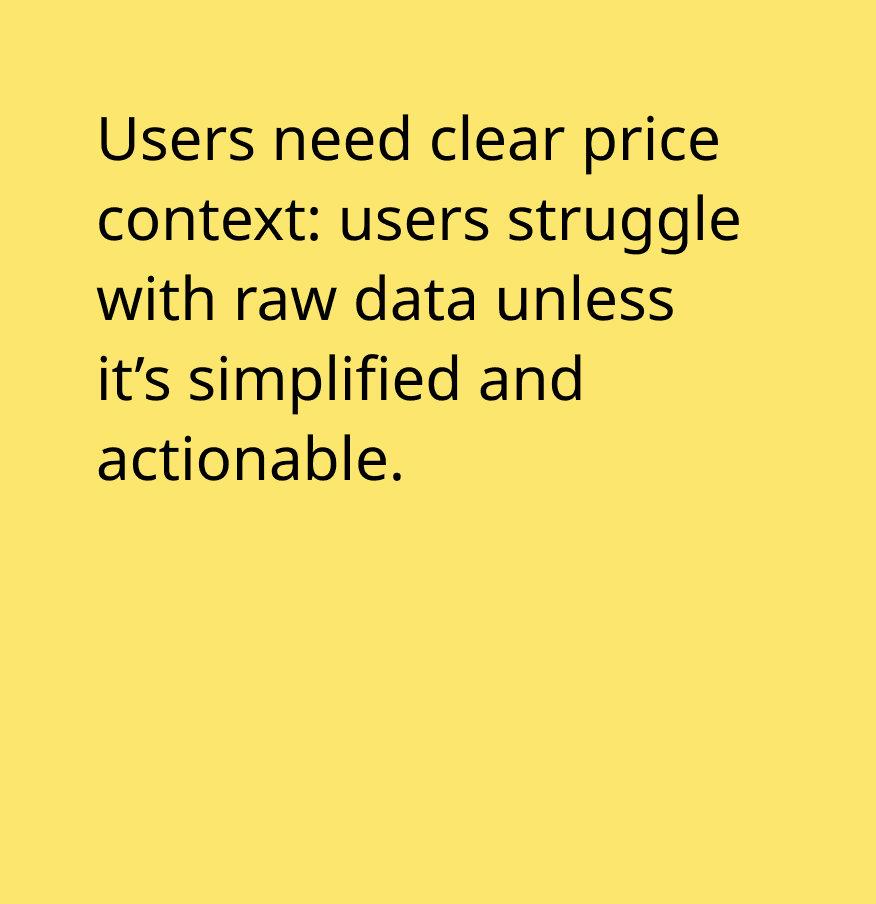

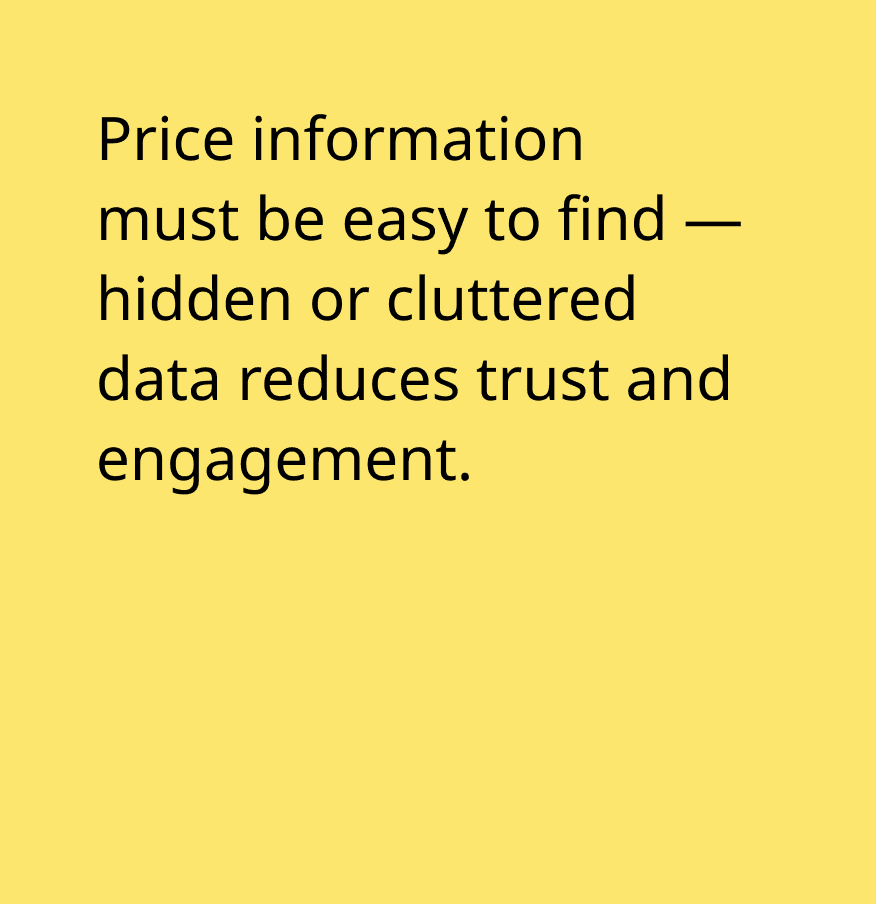
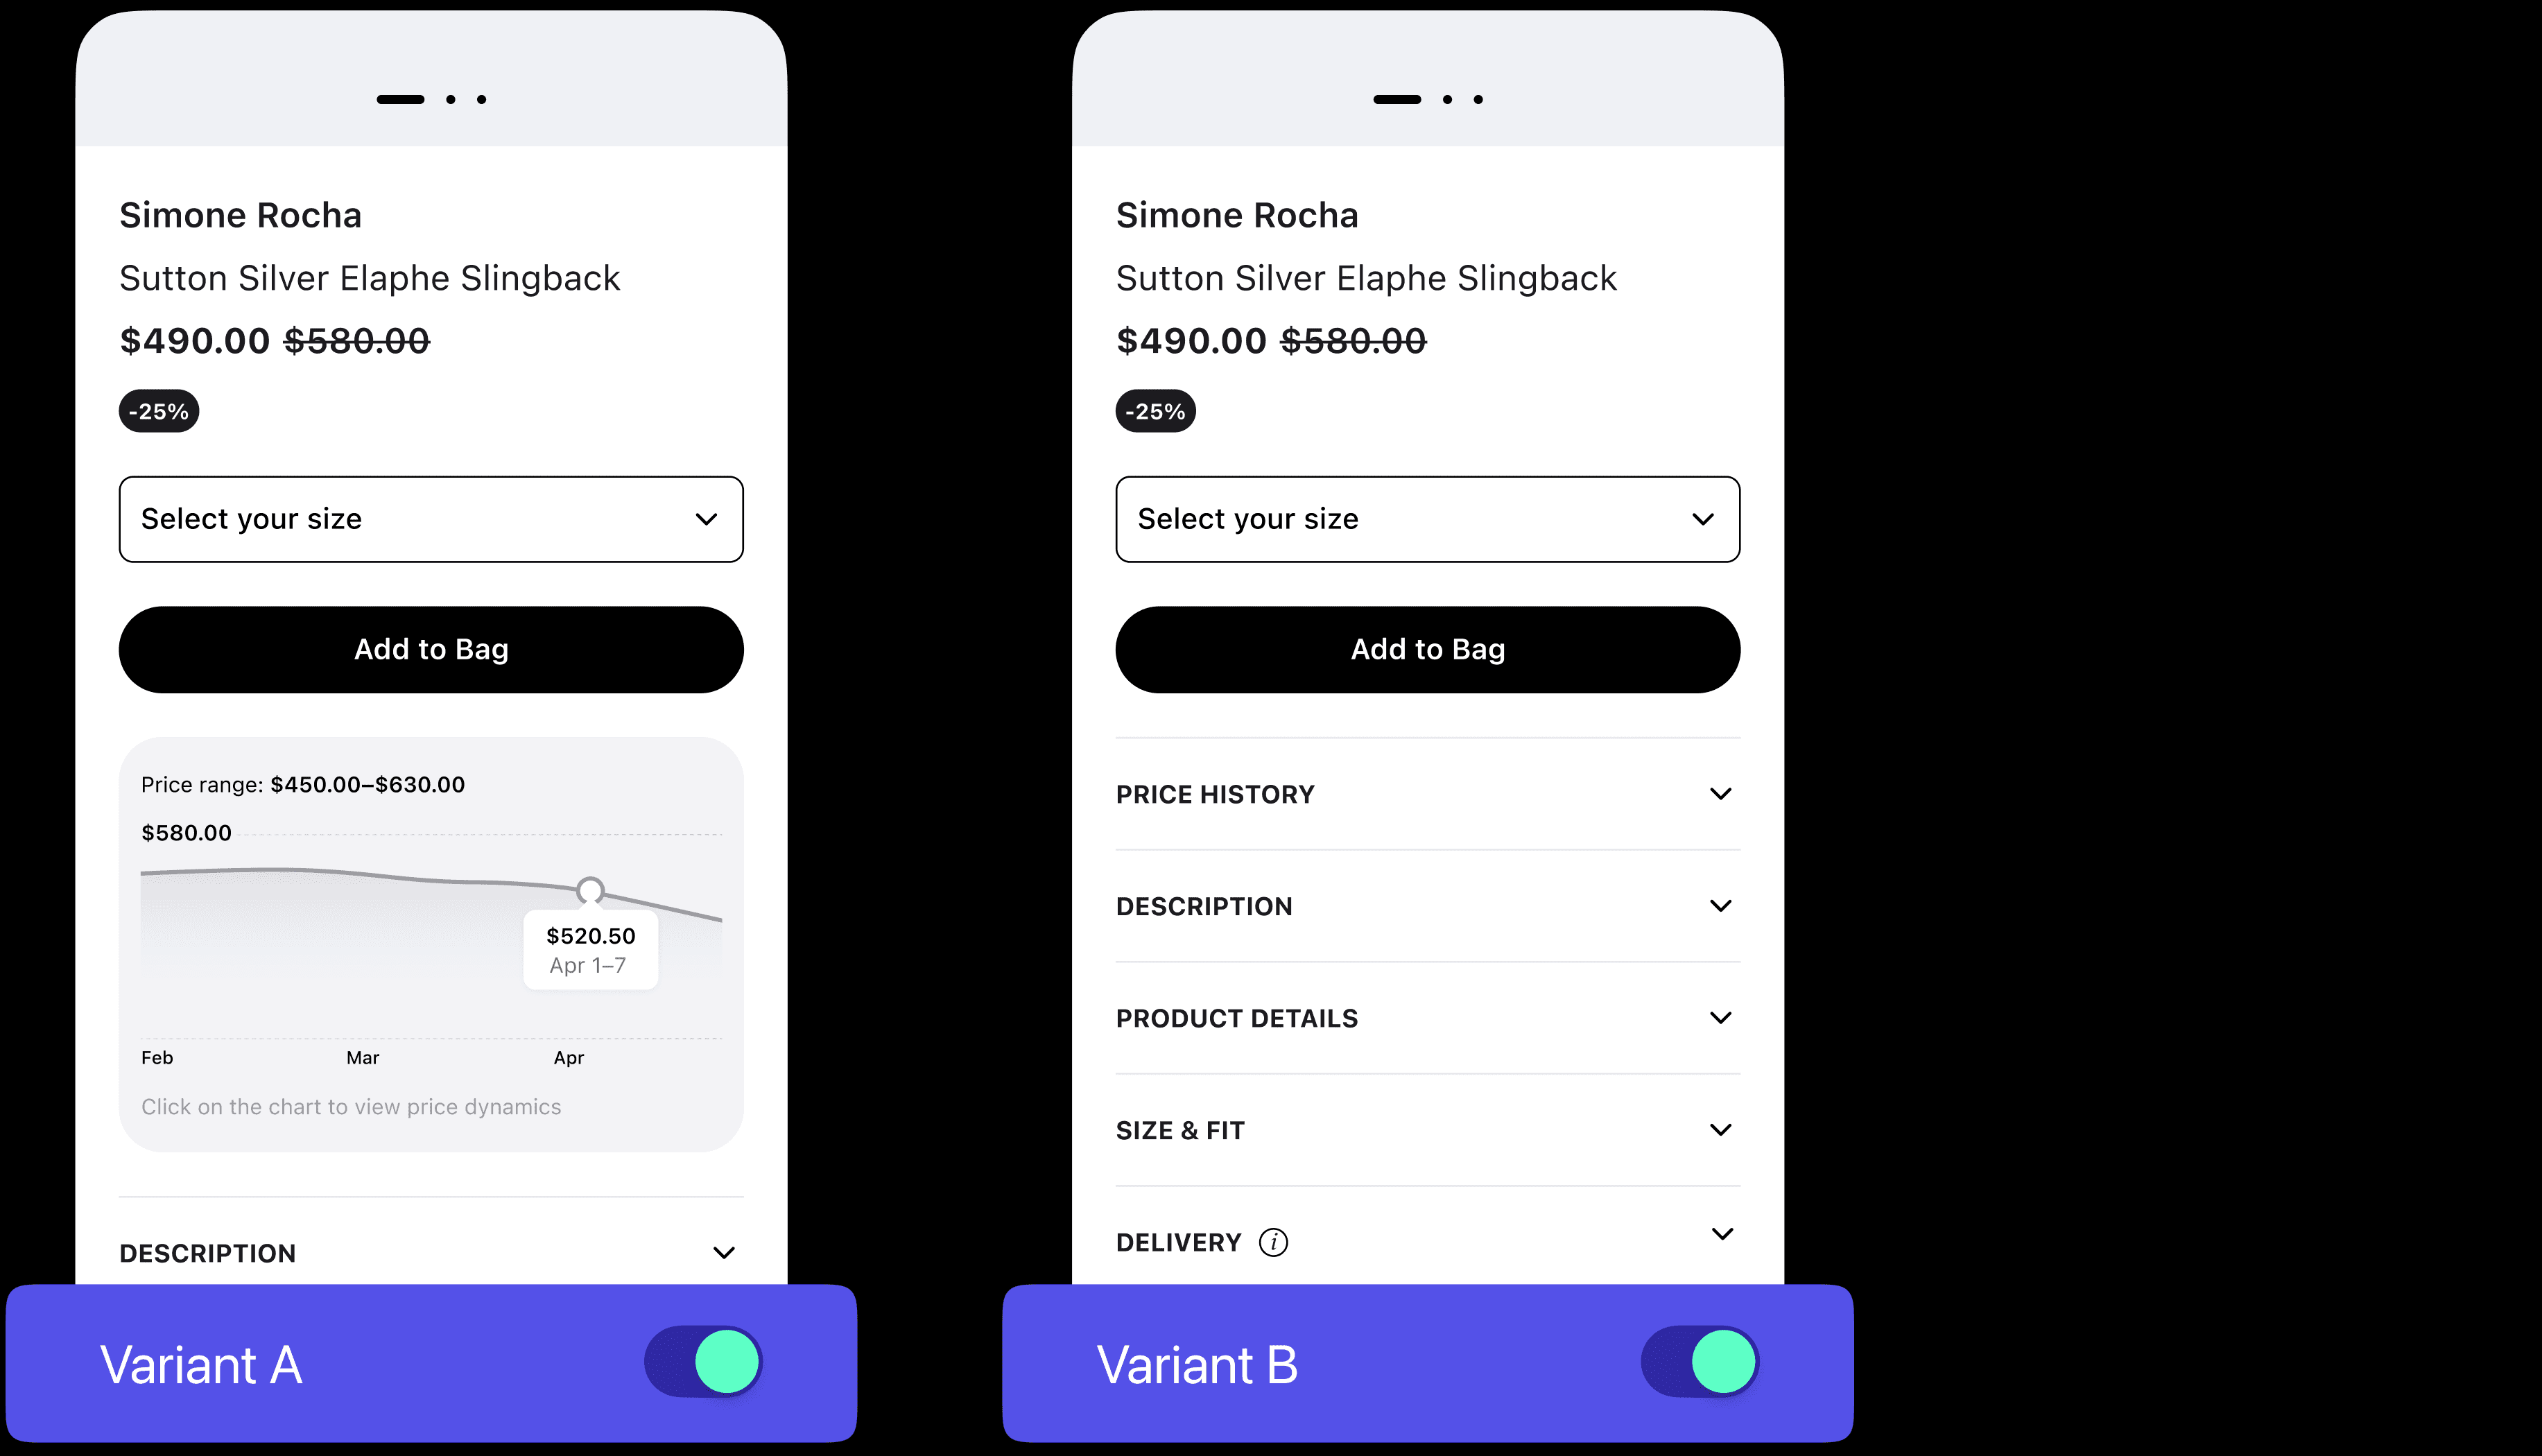
The A/B test results painted a clear picture. In the group with the always-visible chart, 90% of users noted that it immediately caught their attention and helped them assess the deal’s value, while 75% said it would speed up their decision to buy. In the tap-to-expand chart group, 80% found it useful, but only 55% noticed and opened it without prompting, highlighting an issue with discoverability. Interestingly, nearly half of the users in both groups requested price drop notifications.
These insights prompted us to create a second iteration, where we integrated push notifications for price changes to boost user confidence and reduce the fear of missing out on a better deal. We also refined the chart’s microcopy, adding a tooltip: “Today’s price is the best in 30 days,” to make the information even clearer. To confirm the effectiveness of these changes, we planned a larger-scale A/B test with real platform users, tracking conversion rates, time on page, and engagement.